Part 1 of this two-part series looked at the core aspects of Maintenance 4.0 and outlined a comprehensive maintenance process flow. In this second part, we will discuss how to get started with Maintenance 4.0, along with how to develop benchmark metrics that allow assessment of the gap between the current and desired states.
With Maintenance 4.0, the overarching purpose of keeping the asset in a reliable, compliant, and operable state doesn’t change. What is changing, fundamentally, is how we collect intelligence on the asset, how we evaluate the generated data flow from the asset, and how we determine the appropriate actions to execute based on our assessment.
Accurate Data Key To Maintenance 4.0
There’s no point trying to develop into Maintenance 4.0 without accurate information to drive analytical activities. That includes comprehensive data on historical downtime and asset performance, detailed information on the equipment hierarchy, the parts used on the assets, and a clear picture of current asset condition. Collecting, analyzing, and archiving accurate information is the first and most important step toward maturing for Maintenance 4.0.
While lots of companies have monitoring solutions that generate vast amounts of data, most of it goes unused. Some include alerts or warning systems, but they don’t give field technicians enough information about what actions they should take next. This means they miss the opportunity to significantly raise their output by making sure that every component works to its best possible potential.
Collection and analysis of asset reliability data helps to refine and optimize maintenance programs. However, the complexity of ensuring detailed data entry in sophisticated tools sometimes leads to a focus on achieving a comprehensive data set instead of using available historical data to improve the value delivered by maintenance programs. With logs of previous failures, it is possible to find out which components fail the most and which are most critical to performance. With knowledge about the occurrence of the failures, vital patterns may be revealed. Are critical components wearing out (meaning that a time-based replacement approach could be appropriate), or are they regularly failing prematurely (suggesting more analysis is needed to identify the optimal approach)? To answer these questions, a very powerful tool is available in the reliability engineer’s armory: failure modes and criticality effects analysis (FMCEA). FMCEA does not rely on the availability of historical data. While historical data is helpful, a solid understanding of the way the asset works is all that is required to perform FMCEA. It is an effective tool, once the system is in operation, to shape the maintenance program and address failure modes that may have been overlooked during design.
In many cases where there is no evaluation and no records are kept, assessment of the condition of replaced parts in preventive actions creates a data-rich repository. Companies should measure, where possible, observed wear compared to the original key measurements of the piece. The degree of wear is a key indicator of how much time can elapse before that part should be replaced.
Maintenance 4.0 is rooted in connectivity. Data capture happens at the component level of equipment. Bar code scanners are deployed to link production runs with equipment settings and environmental conditions. Those data points are converted into information and represented as metrics or performance indicators. Where the infrastructure for data exchange is paper-based, collection typically happens through regular and repetitive inspection rounds. Inspection rounds limit the ability to record everything around the clock, which is typically seen as a drawback, but in reality, it is a blessing in disguise. Because not everything can be measured, recorded, and analyzed, measurements need to be limited to the critical measures and reported as key performance indicators (KPIs). KPIs can be based on metrics, providing the next level of detail in advanced analytics.
Manual data collection is flexible and versatile. Corporate ERP systems expect a standardized data format. Maturing to Maintenance 4.0 requires the organization to convert a manual data collection system to the expected ERP standards, ideally without losing that flexibility and versatility. If the ERP master data can handle empty data entry fields, without crippling the calculations, a lot is possible.
Maintenance 4.0 Supports Appropriate Sourcing Of Consumables And Spare Parts
OEM-recommended parts, originating from the capital expenditure project spare parts list for the assets, typically crowd spare parts warehouses. Some of these parts are never touched once put in stock. With a comprehensive and robust preventive and predictive process in place, it is known which consumables and replacement parts are required to perform those preventive and predictive tasks. Through procurement, the lead time for a specific part is known, and goods receipt information can reveal how much time is needed for the acceptance, inspection, and release of the spare part before it’s available for deployment. A detailed assessment of all components in the spare parts warehouse can release cash that is several tens of percent of the value of the warehouse. In the new constellation, the parts warehouse only holds critical spare parts and parts with excessive lead times. Agreements are drawn up with OEMs to make spare parts available for delivery within 4 hours/8 hours/next day. For scheduled work, such as preventive and predictive maintenance, the required quantities of consumables and parts are ordered in advance of the planned tasks. Companies are already piloting printing replacement parts on-site with 3D printers, instead of ordering them and putting them in stock. An additional benefit for large facilities is that warehouse space can become available for alternate use.
As part of maintenance, spare parts are always seen as a significant cost item. The approach described makes it possible to have a major one-time cost reduction and to maintain the spare parts cost-efficiently and modestly in the future. However, to ensure that spare parts sourcing always functions properly and under all circumstances, the governing administrative process must function perfectly and operate flawlessly. Within Maintenance 4.0 the design, implementation, and execution of such processes need to be covered.
KPIs Provide Guidance, Direction
A pilot-and-rollout (Gemba) approach is still the best and most sustainable way to transform operations. Like any other transformation effort, maturing to Maintenance 4.0 requires people to change how they work together, develop new skills, and agree on new ways to report performance. All those things take time to get right.

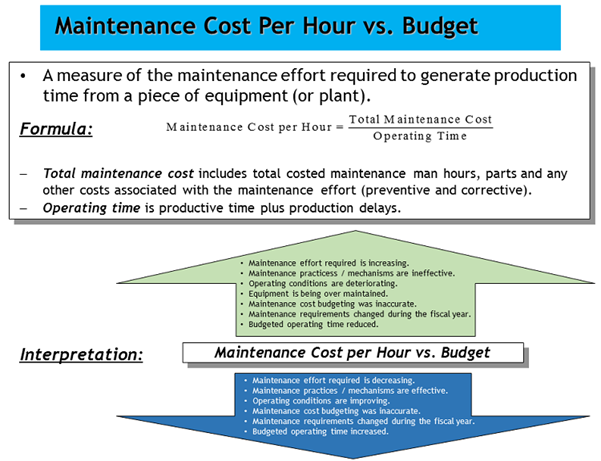
Figure 1: KPI title, description, formula, and interpretation for target value and value changes
Accurate information to drive analytical activities comes from detailed data on historical downtime and asset performance. Collecting, analyzing, and archiving precise information doesn’t have to and shouldn’t wait for Maintenance 4.0. Ahead of deploying Maintenance 4.0, design, develop, and deploy metrics and KPIs, linking expectations from operations, business, and society with technical availability and reliability. Better still, organizational transformation to Maintenance 4.0 is more straightforward and goes more smoothly with all the organizational changes done in advance, instead of as part of the Maintenance 4.0 implementation. Accurate and detailed information does not mean that you need to report every data point ever measured. Smartly designed, appropriately escalated KPIs are built up from metrics, providing visibility and direction for their owner. Such information can be paper-based, in basic spreadsheets, or from ERP systems.
When an existing organization is functioning well, there is no need to start from a blank sheet of paper. A workshop for maintenance and engineering to establish where they are, where they want to go, and with what to start is an excellent first step for the transformation toward Maintenance 4.0. Use the existing Annual Maintenance Plan as a starting point, with the corrective and reactive maintenance work from the last few years for comparison. For the replaced parts that caused a malfunction or broke, assess the frequency of preventive maintenance and adjust where necessary. For components not included in the preventive scheme and that have a risk priority number (RPN) above the threshold, determine whether maintenance is needed and whether it can be done through periodic inspection, can be predictively monitored, or should be preventively implemented.
Benchmarking Establishes Starting Position
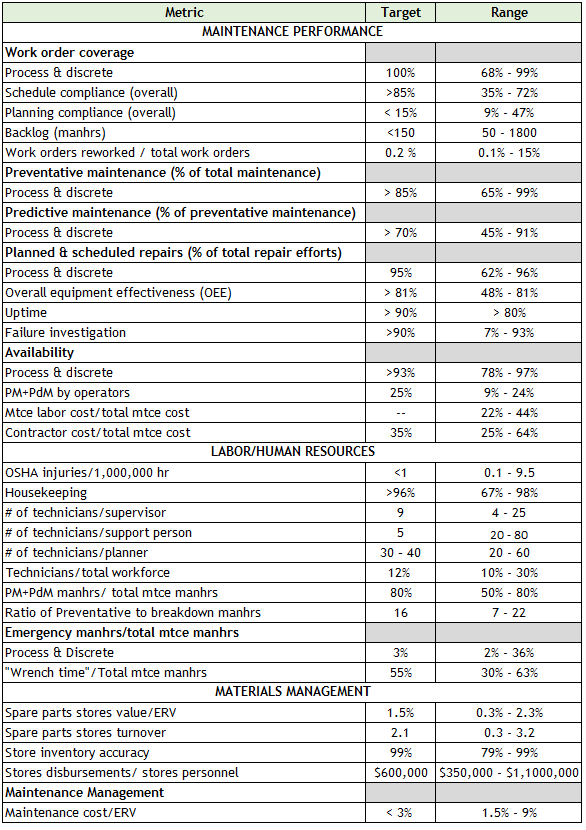
Over the last three decades, the data in Table 1 was collected from different sources, such as large consultancy firms active with the maintenance function at manufacturing companies, large corporations themselves, and personal experience in the maintenance function. These performance metrics are valuable measurements to compare business processes for maturity.
The target value is typically a number that exemplary corporations achieve, and the range is what is usually found across corporations. The numbers presented do not come from pharmaceutical corporations alone but are collected across different industries, such as food for special medical purpose, fine chemicals, and biotech. The data was collected from bioprocessing and fill finish facilities, comprehensive full capability production sites, processing plants, and packaging sites.
Table 1: Maintenance Benchmark Metrics Overview

As a company grows toward Maintenance 4.0, periodic inspections can transform into continuous measurements. That seems nice, but it creates a lot of data. This is desirable for certain inspections, but not for others. The costs of continuous measurements can be disproportionate. Room temperature in a warehouse does not change very quickly; therefore, very accurate and continuous logging, which is expensive, is not always necessary. Logging at intervals of seconds allows for simpler equipment without compromising the quality of the recording.
The importance of accurate data from the assets also emerges for work preparation; without detailed drawings and up-to-date information, the correct replacement parts cannot be ordered, and the required tools cannot be made available. Exact drawings are essential for this. On the path to Maintenance 4.0, detailed drawings are a prerequisite.
Conclusion
Maturing to Maintenance 4.0 begins with accurate data, meaningful metrics, comprehensive drawings, robust maintenance planning and scheduling, and appropriately sourced consumables and spare parts. Existing procedures, processes, and skills and training requirements will likely need to be adjusted to be future-proofed. When one of those elements is missing, incomplete, or significantly behind, that would be one of the first tasks to perform to mature toward Maintenance 4.0. Maintenance itself does not change that much, but what does change is how we approach maintenance. Through better measurements, we know more about the assets and can therefore better assess what to do with those assets, how, and when. Once in place, advanced analytics, based on the three axes discussed in Part 1 – society (environment, health & safety), business (spent as a percentage of total asset value), and operations (uptime, OEE) – provide an avenue to further optimize and enhance customer satisfaction.

Leave a Reply